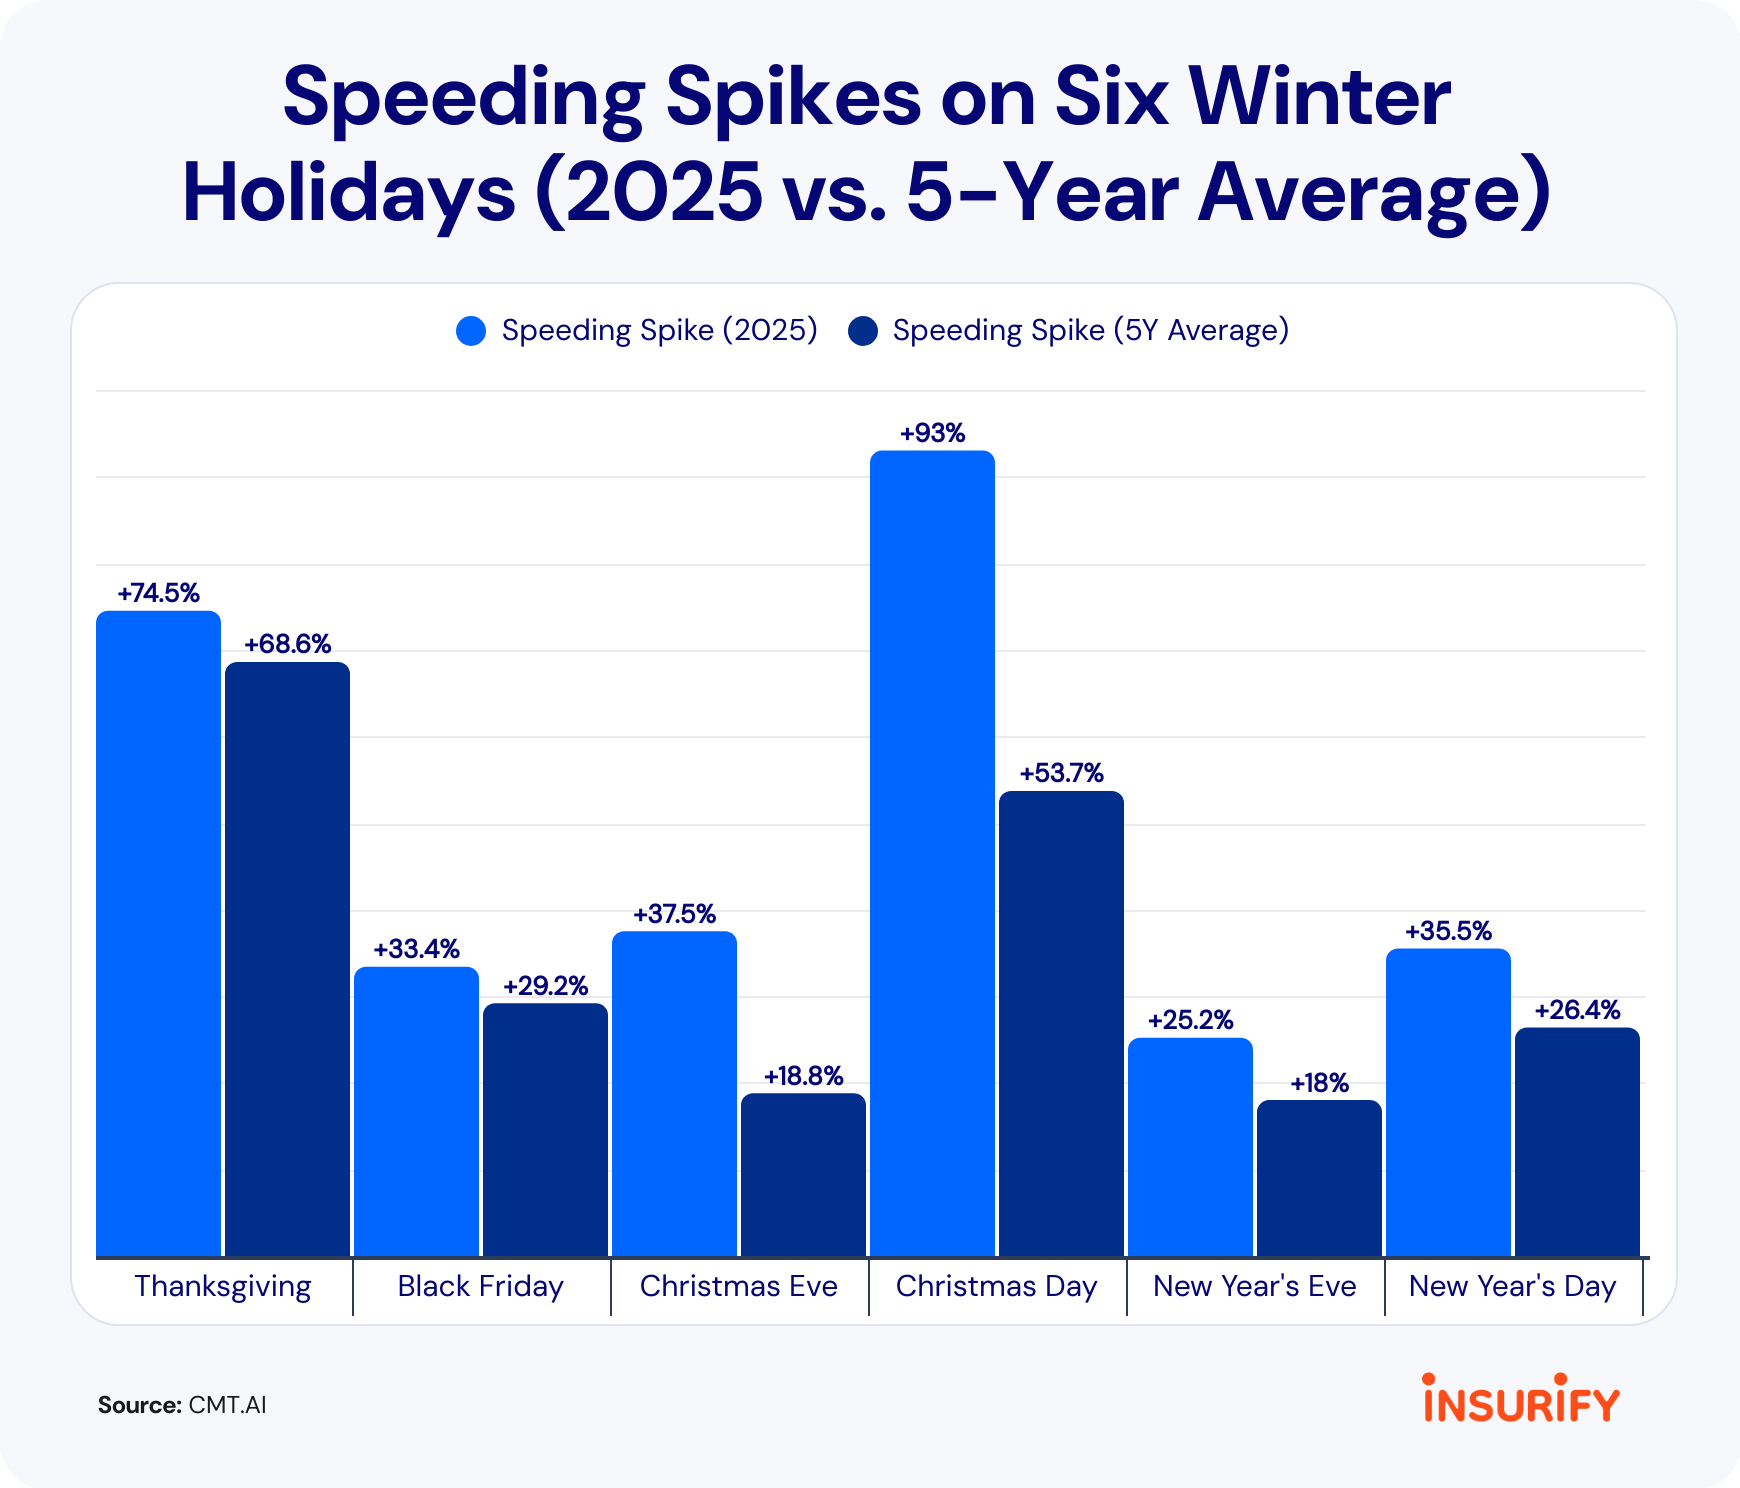
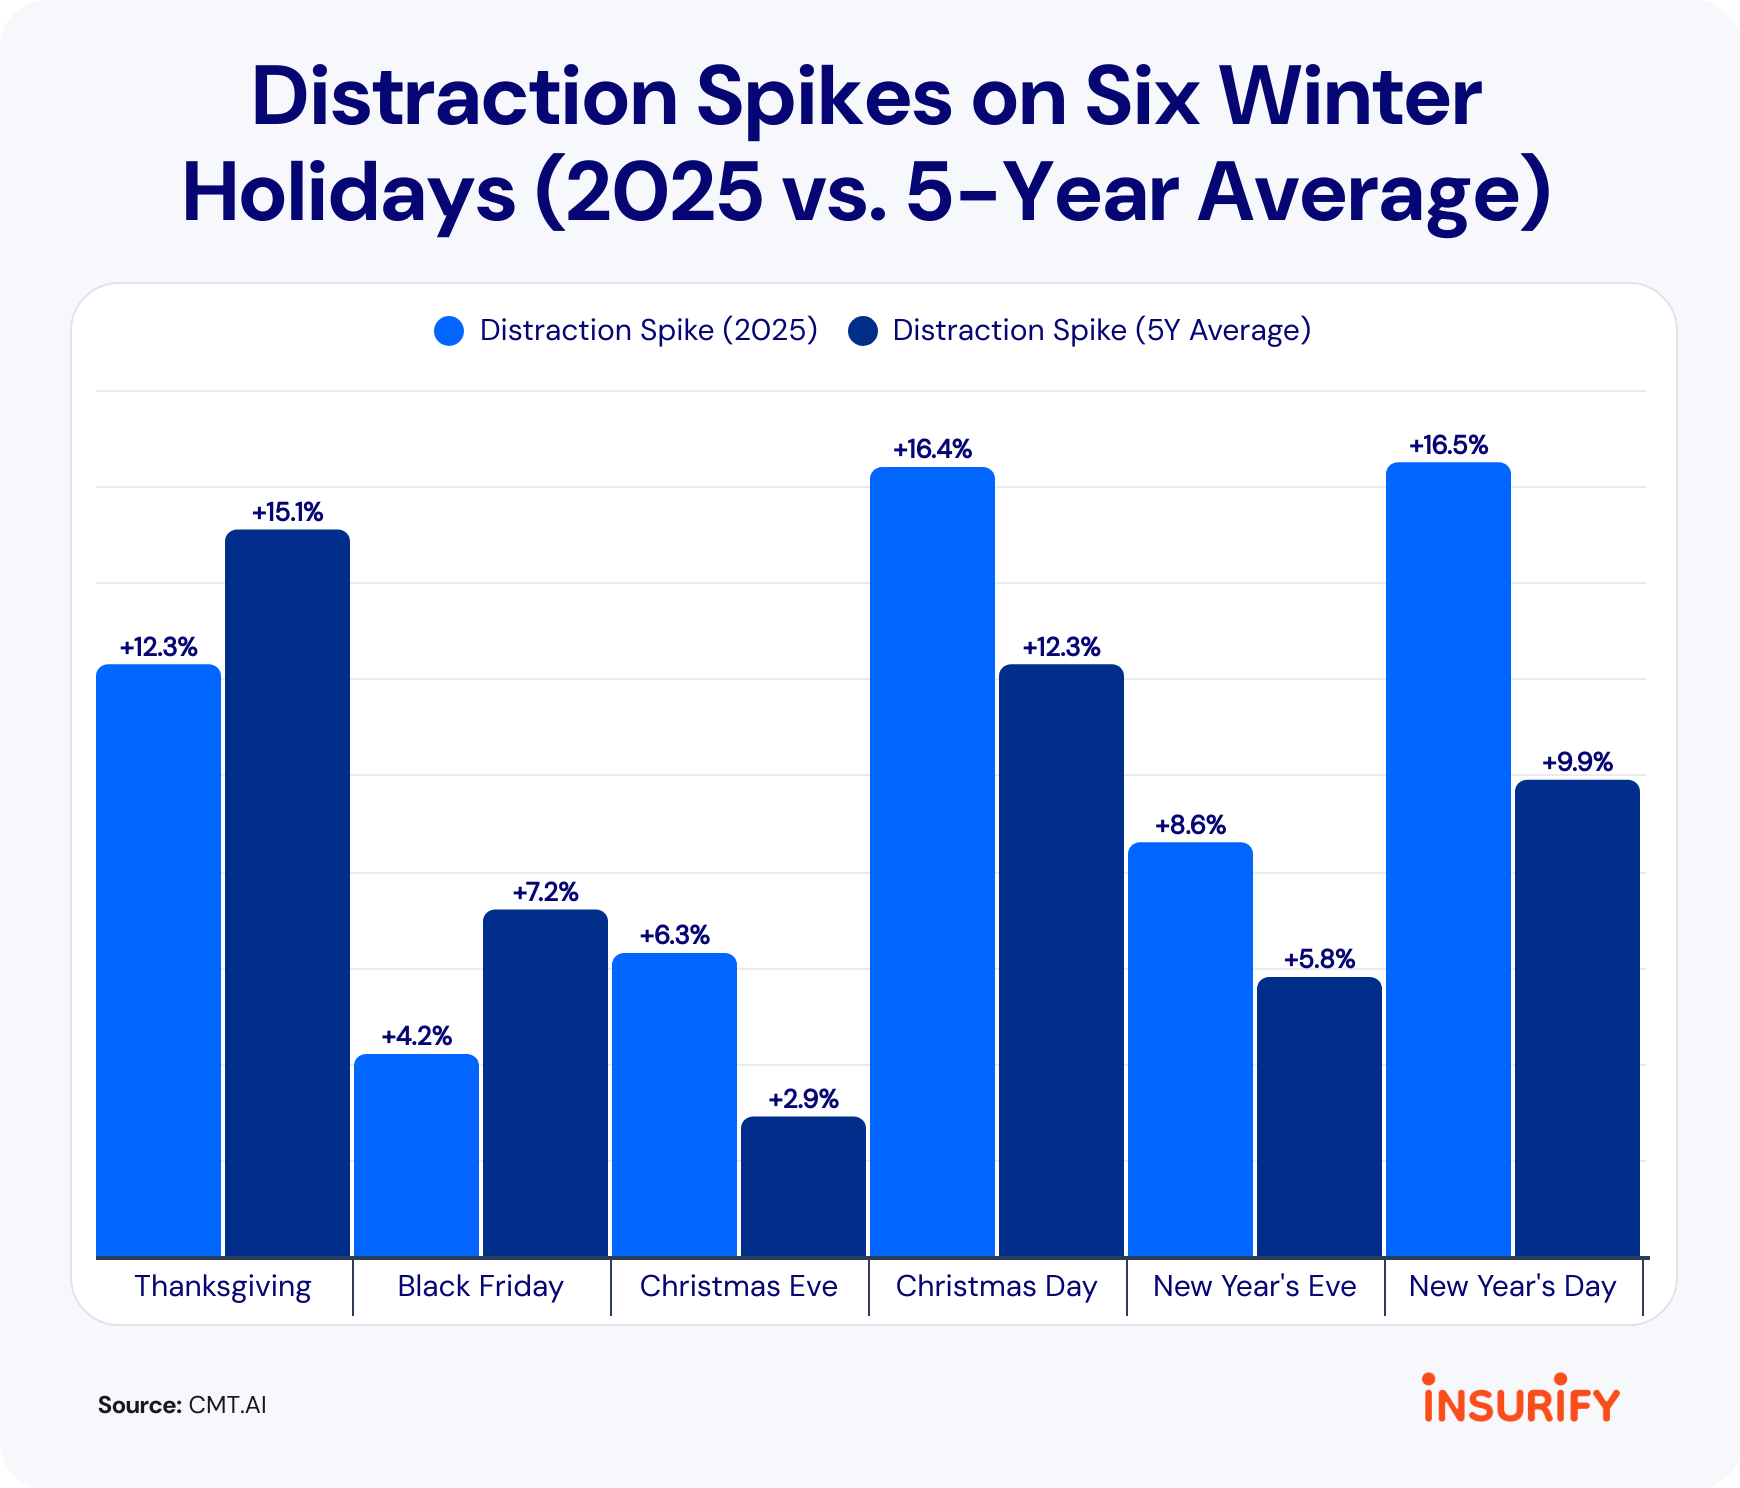
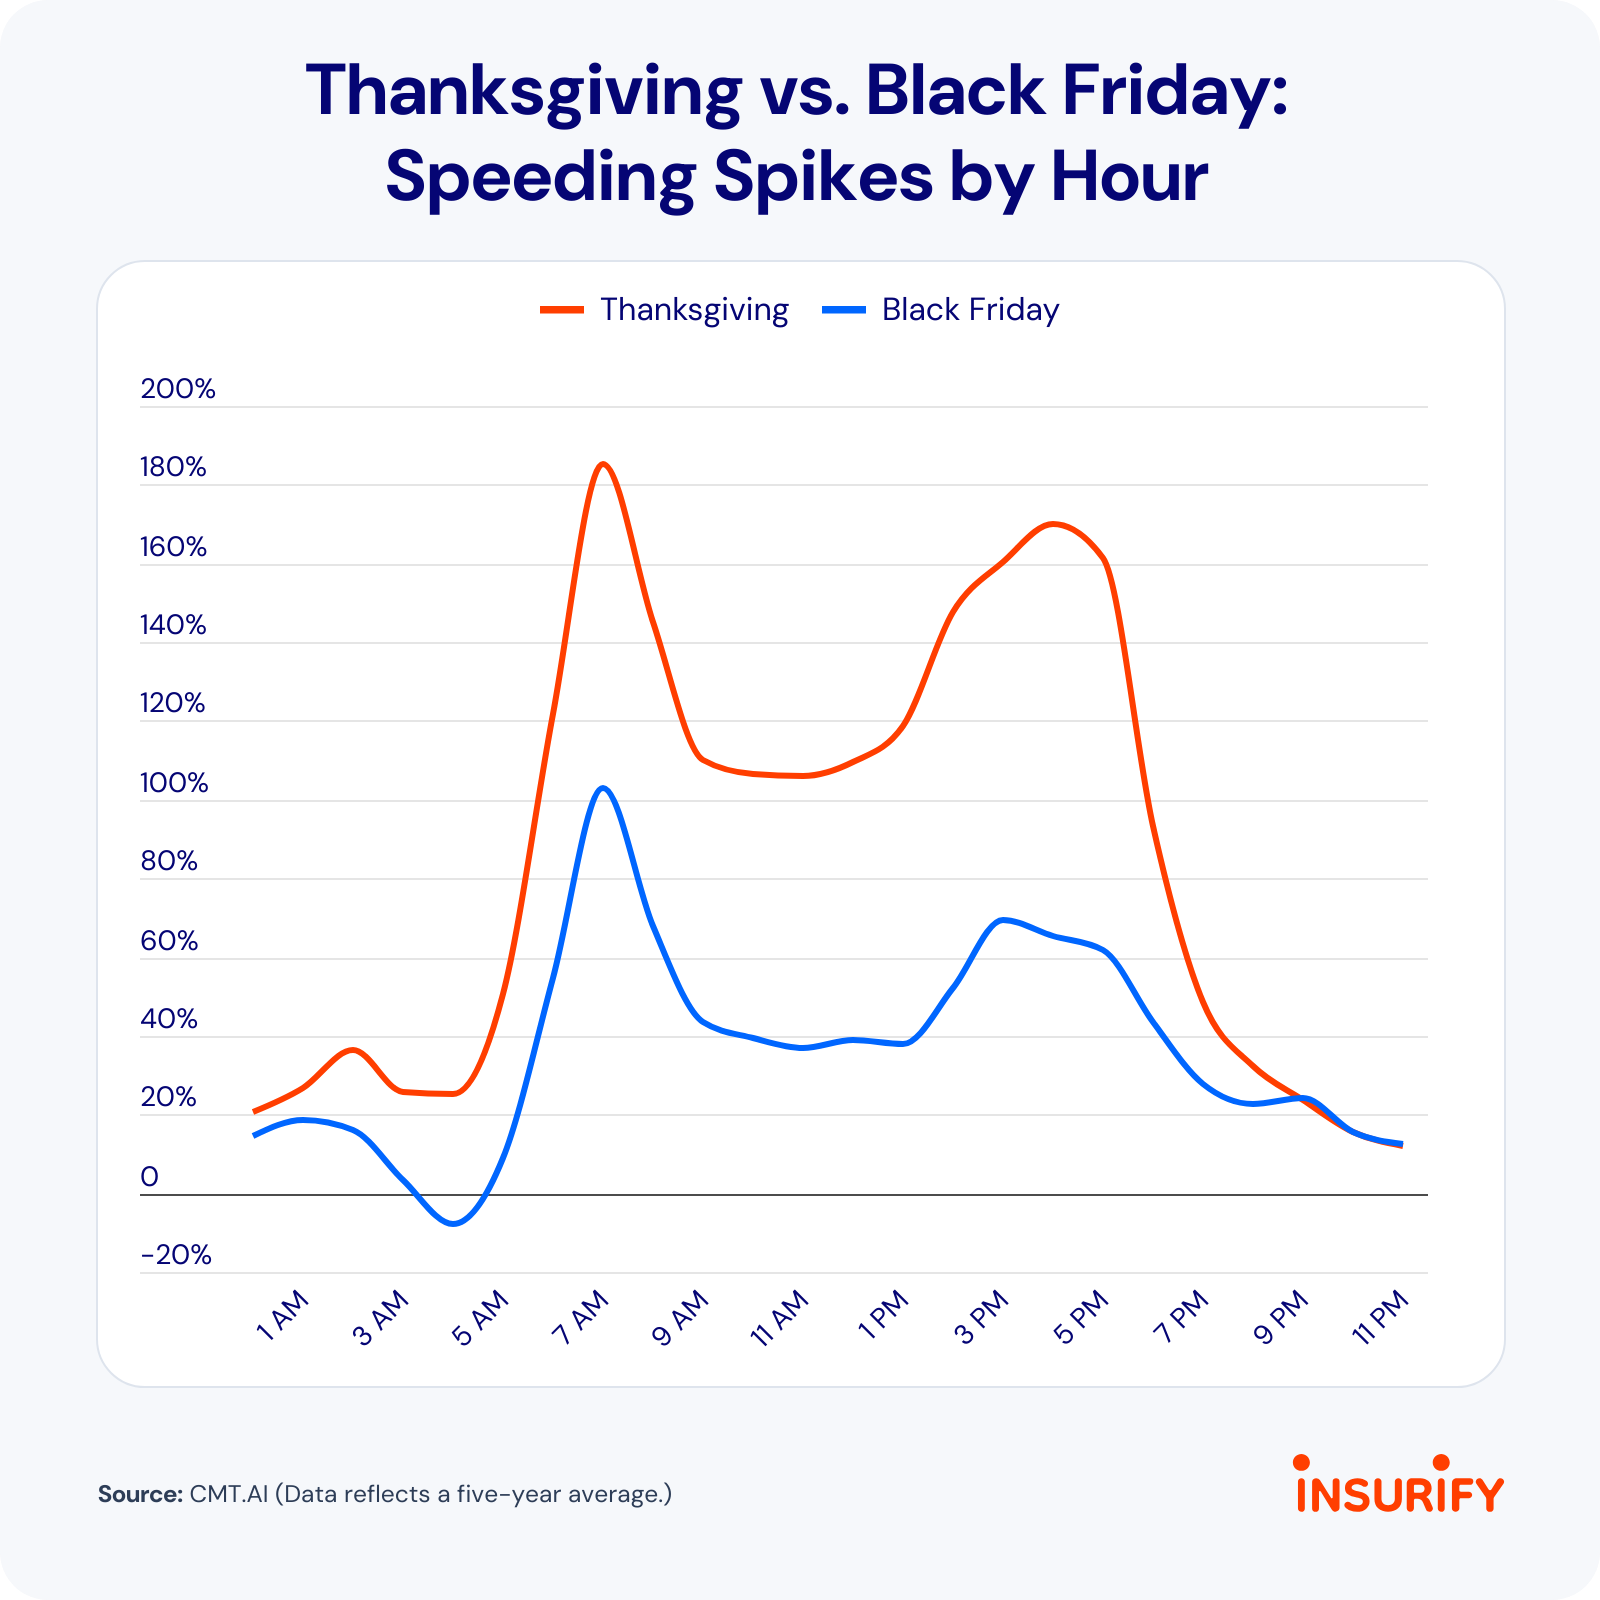
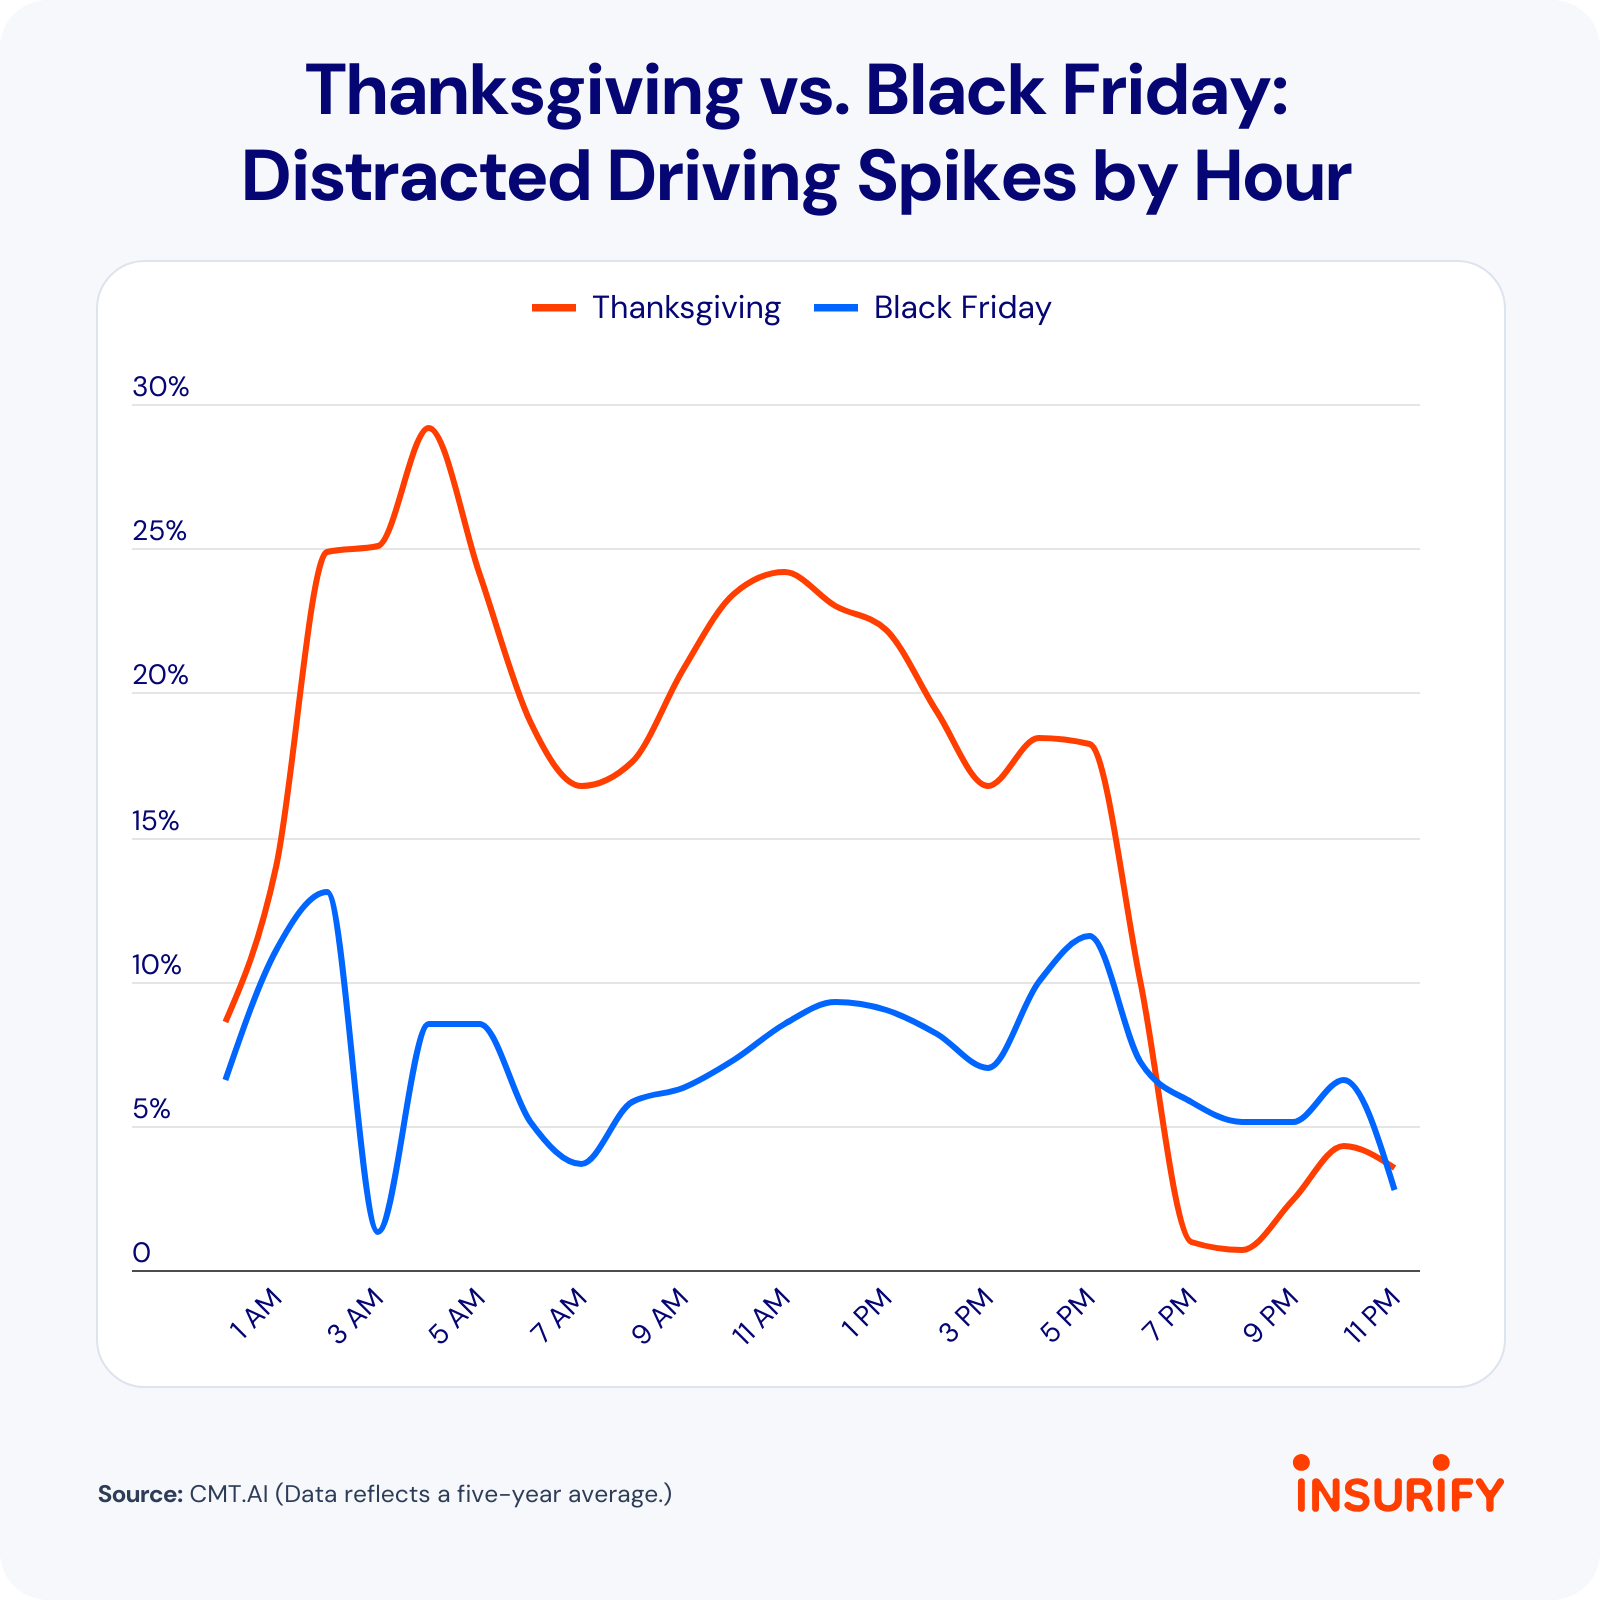
Which holiday changes driving behavior the most in each state
Drivers in all areas of the U.S. could benefit from being extra careful behind the wheel during the year-end holiday season. In every state, distracted driving spikes on at least one of the six winter holidays Insurify analyzed, according to CMT.AI data. But whether distracted driving spikes higher on Thanksgiving versus Christmas Day, for example, varies by state.
In 37 states, Thanksgiving has the highest spike in distracted driving relative to similar days, compared with the other five holidays. Among them, Vermont has the largest spike, with drivers spending 39.2% more time interacting with their phones than on similar days.
In eight states, Christmas Day is the most-distracted holiday, and in four states, it’s New Year’s Day. New York is among the states with the highest increase in distracted driving on New Year’s Day, where drivers spend 17% more time interacting with their phones than on similar days. New York City’s famous New Year’s celebrations could contribute to higher levels of risky driving.
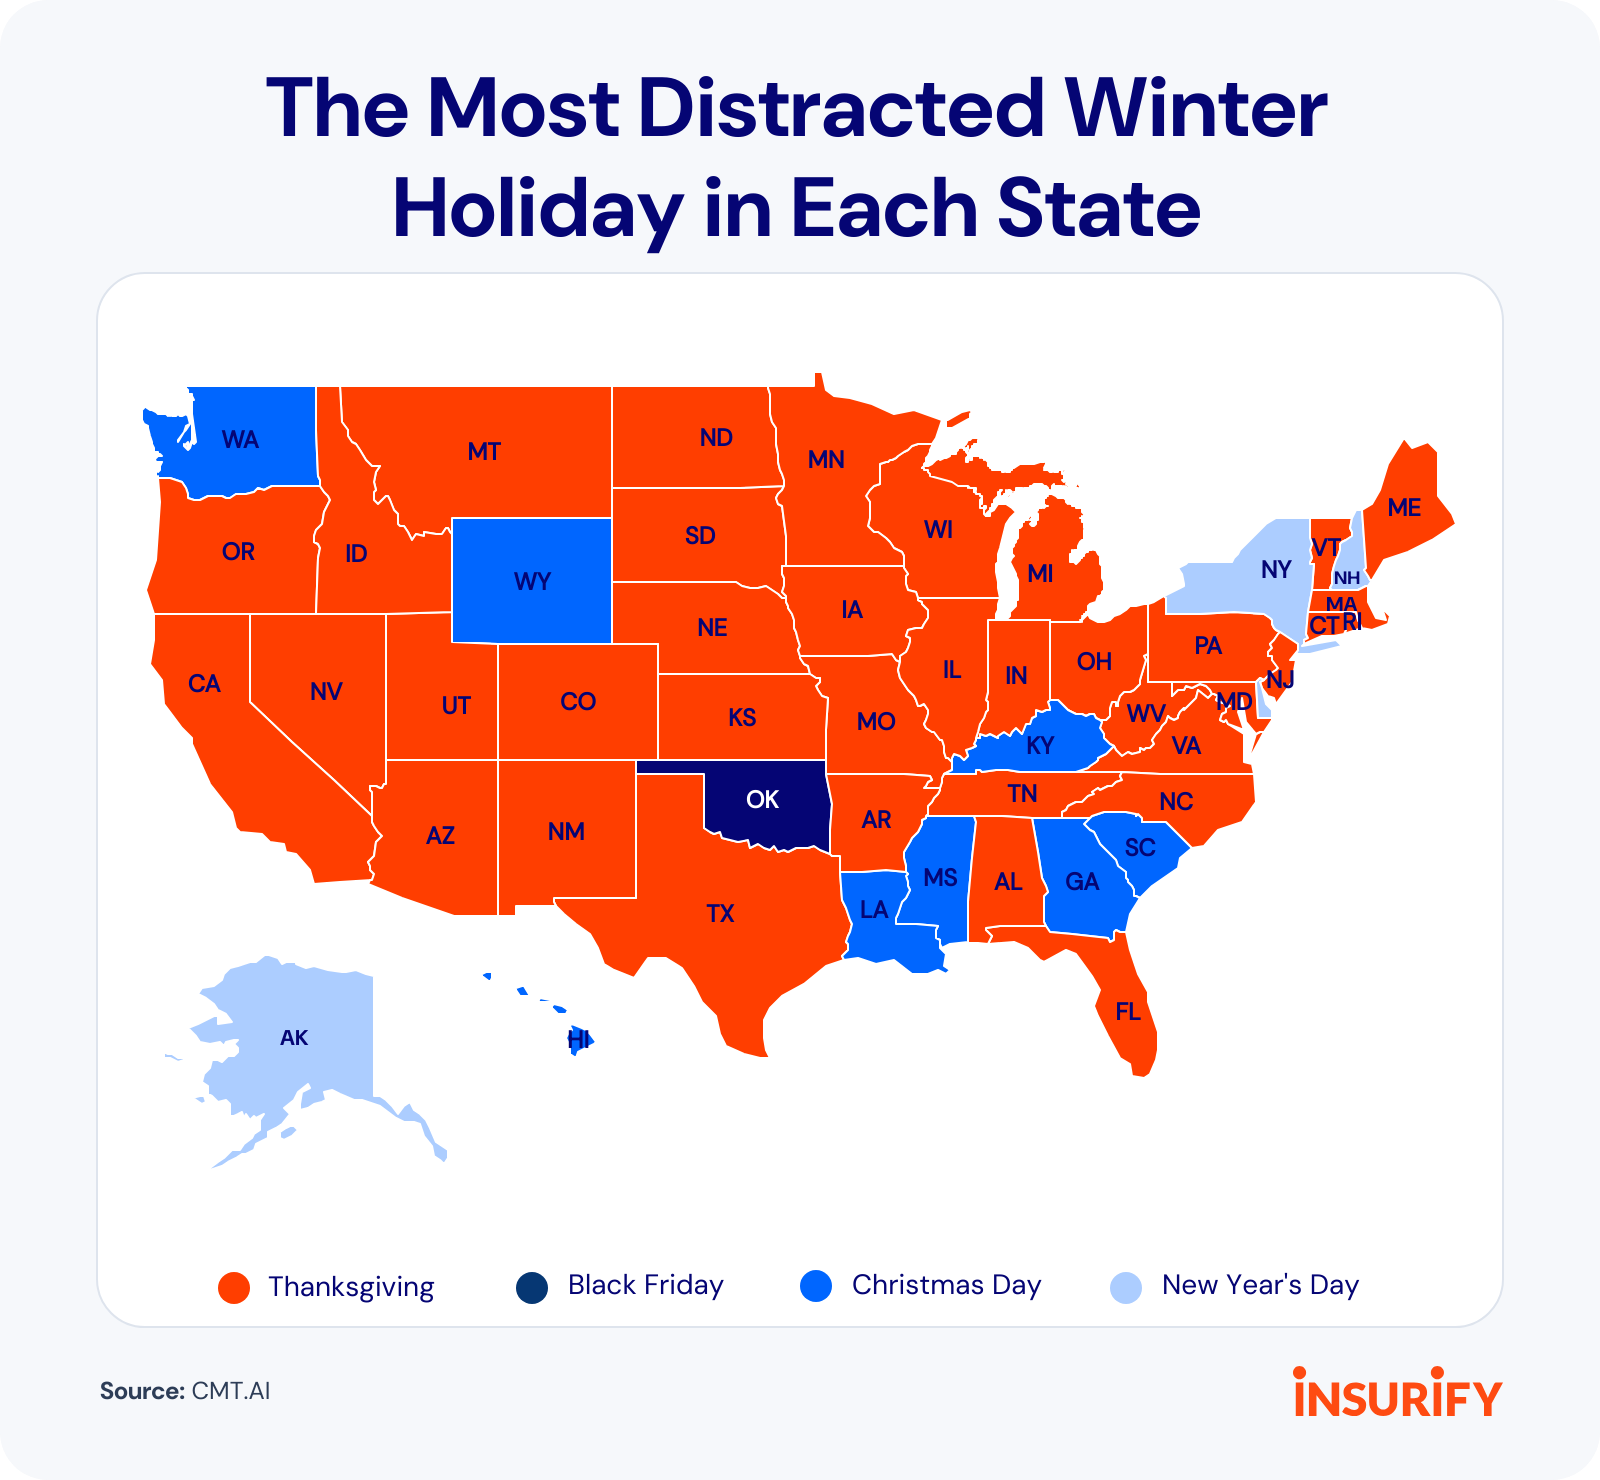
| Most Distracted Holiday Compared to Similar Days | Thanksgiving Distraction Spike | Black Friday Distraction Spike | Christmas Eve Distraction Spike | Christmas Day Distraction Spike | New Year’s Eve Distraction Spike | New Year’s Day Distraction Spike |
|---|
| Alaska | New Year’s Day | +6.9% | +8.7% | +10.2% | -0.4% | +14.4% | +20.2% |
|---|
| Alabama | Thanksgiving | +9.0% | +8.1% | -1.4% | +6.4% | -1.7% | +0.5% |
|---|
| Arkansas | Thanksgiving | +13.0% | +8.6% | +1.1% | +12.1% | +0.7% | +12.8% |
|---|
| Arizona | Thanksgiving | +14.6% | +6.8% | +0.3% | +11.7% | +5.8% | +10.3% |
|---|
| California | Thanksgiving | +2.0% | -0.9% | -3.1% | -1.0% | +0.7% | +2.0% |
|---|
| Colorado | Thanksgiving | +12.7% | +7.3% | +0.3% | +6.9% | +6.1% | +9.0% |
|---|
| Connecticut | Thanksgiving | +23.1% | +9.0% | +5.5% | +17.5% | +3.5% | +11.0% |
|---|
| Delaware | New Year’s Day | +13.9% | +4.7% | +7.8% | +13.4% | +1.2% | +15.0% |
|---|
| Florida | Thanksgiving | +14.3% | +5.3% | +1.7% | +7.5% | +5.4% | +9.2% |
|---|
| Georgia | Christmas Day | +12.7% | +5.6% | +5.1% | +13.1% | +7.1% | +9.0% |
|---|
| Hawaii | Christmas Day | +21.2% | -1.4% | +10.9% | +24.7% | +0.7% | +2.7% |
|---|
| Iowa | Thanksgiving | +21.1% | +9.8% | +7.3% | +11.8% | +4.8% | +1.9% |
|---|
| Idaho | Thanksgiving | +20.2% | +7.2% | +3.5% | +14.2% | -0.5% | +15.8% |
|---|
| Illinois | Thanksgiving | +17.7% | +7.6% | +0.8% | +8.5% | +4.5% | +11.1% |
|---|
| Indiana | Thanksgiving | +24.4% | +9.7% | +1.9% | +23.5% | +7.3% | +9.4% |
|---|
| Kansas | Thanksgiving | +12.6% | +8.3% | +1.6% | +7.7% | +3.1% | +5.7% |
|---|
| Kentucky | Christmas Day | +14.0% | +9.6% | -2.6% | +15.8% | +7.7% | +11.2% |
|---|
| Louisiana | Christmas Day | +8.0% | +6.8% | -2.8% | +8.0% | +1.5% | +0.4% |
|---|
| Massachusetts | Thanksgiving | +19.1% | +9.2% | +8.0% | +15.4% | +7.8% | +16.1% |
|---|
| Maryland | Thanksgiving | +21.2% | +5.0% | +8.4% | +15.1% | +9.7% | +10.5% |
|---|
| Maine | Thanksgiving | +32.5% | +9.0% | -10.5% | +9.3% | +11.3% | +24.9% |
|---|
| Michigan | Thanksgiving | +24.0% | +8.0% | +4.5% | +14.0% | +6.0% | +10.9% |
|---|
| Minnesota | Thanksgiving | +25.1% | +11.6% | +11.8% | +17.9% | +10.3% | +14.5% |
|---|
| Missouri | Thanksgiving | +12.4% | +3.6% | +3.3% | +5.3% | +1.6% | +9.1% |
|---|
| Mississippi | Christmas Day | +16.0% | +5.6% | +0.5% | +23.7% | +2.0% | +3.7% |
|---|
| Montana | Thanksgiving | +32.7% | +9.0% | -1.5% | +17.4% | +3.4% | +16.2% |
|---|
| North Carolina | Thanksgiving | +11.3% | +6.7% | -2.3% | +8.5% | +3.4% | +7.5% |
|---|
| North Dakota | Thanksgiving | +17.4% | -0.7% | +1.6% | +13.5% | +15.5% | +13.2% |
|---|
| Nebraska | Thanksgiving | +16.2% | +14.9% | -2.2% | +13.6% | +10.8% | +10.5% |
|---|
| New Hampshire | New Year’s Day | +15.2% | +13.8% | -0.9% | +12.3% | +0.2% | +20.2% |
|---|
| New Jersey | Thanksgiving | +16.5% | +7.1% | +3.2% | +10.6% | +10.3% | +11.7% |
|---|
| New Mexico | Thanksgiving | +19.7% | +6.2% | -7.1% | +9.3% | +0.7% | +5.5% |
|---|
| Nevada | Thanksgiving | +21.0% | +6.8% | +1.0% | +15.7% | +7.9% | +3.1% |
|---|
| New York | New Year’s Day | +11.5% | +2.1% | +1.8% | +14.6% | +3.1% | +17.0% |
|---|
| Ohio | Thanksgiving | +22.0% | +14.1% | +3.3% | +14.4% | +7.0% | +9.3% |
|---|
| Oklahoma | Black Friday | +11.9% | +11.9% | -2.5% | +6.0% | +2.2% | +7.8% |
|---|
| Oregon | Thanksgiving | +17.9% | +8.9% | +0.7% | +15.1% | +10.9% | +9.9% |
|---|
| Pennsylvania | Thanksgiving | +14.7% | +7.5% | +4.4% | +10.3% | +9.4% | +11.4% |
|---|
| Rhode Island | Thanksgiving | +17.0% | +8.7% | +4.0% | +13.1% | +4.3% | +14.1% |
|---|
| South Carolina | Christmas Day | +6.9% | +8.1% | +3.1% | +9.9% | +1.6% | +2.8% |
|---|
| South Dakota | Thanksgiving | +16.5% | +7.2% | -0.2% | -0.5% | +16.2% | -1.4% |
|---|
| Tennessee | Thanksgiving | +14.0% | +7.4% | +1.1% | +10.1% | +1.9% | +5.6% |
|---|
| Texas | Thanksgiving | +10.2% | +4.0% | +1.0% | +9.5% | +4.8% | +6.8% |
|---|
| Utah | Thanksgiving | +21.2% | +15.6% | +5.9% | +20.9% | +5.6% | +15.0% |
|---|
| Virginia | Thanksgiving | +18.5% | +9.3% | +2.1% | +16.2% | +8.2% | +8.3% |
|---|
| Vermont | Thanksgiving | +39.2% | +29.3% | +4.1% | +4.6% | +11.9% | +10.7% |
|---|
| Washington | Christmas Day | +14.0% | +5.6% | +6.4% | +14.8% | +11.1% | +6.8% |
|---|
| Wisconsin | Thanksgiving | +19.1% | +11.3% | +8.9% | +15.8% | +7.5% | +15.2% |
|---|
| West Virginia | Thanksgiving | +15.8% | +6.9% | +3.1% | +15.3% | +2.5% | +3.3% |
|---|
| Wyoming | Christmas Day | -4.2% | -6.7% | -1.2% | +6.8% | -14.0% | -2.3% |
|---|
Note: Spikes are rounded to one decimal place. Where two holidays appear tied, the most distracted holiday is based on unrounded figures.
Of the six holidays, three have the highest distracted-driving spikes in most states: Thanksgiving, Christmas Day, and New Year’s Day. But in a few states, the holiday on the day before or after has higher spikes in distracted driving.
Compared with Thanksgiving, only Alaska, Oklahoma, and South Carolina have higher distracted-driving spikes on Black Friday — and in Oklahoma, it’s practically a tie. Alaska also has a higher spike in distracted driving on Christmas Eve than on Christmas Day.
New Year’s is a bit more varied. New Year’s Day still sees high distracted-driving spikes in most states, but in nine states, drivers spend more time interacting with their phones on New Year’s Eve. South Dakota, Nevada, and Washington have the largest spikes compared to New Year’s Day.
Distracted driving levels in the most expensive states for car insurance
Among the 10 most expensive states for car insurance, distracted driving spikes highest on Thanksgiving in six states, Christmas Day in two states, and New Year’s Day in two states. On Thanksgiving, Michigan drivers spend 24% more time distracted than on similar days, according to CMT.AI data.
| Average Annual Full-Coverage Car Insurance Premium | Most Distracted Holiday Compared to Similar Days |
|---|
| Maryland | $3,880 | Thanksgiving (+21.2%) |
|---|
| Rhode Island | $3,611 | Thanksgiving (+17%) |
|---|
| Michigan | $3,229 | Thanksgiving (+24%) |
|---|
| Georgia | $3,109 | Christmas Day (+13.1%) |
|---|
| Delaware | $3,100 | New Year’s Day (+15%) |
|---|
| South Carolina | $3,075 | Christmas Day (+9.9%) |
|---|
| Nevada | $3,039 | Thanksgiving (+21%) |
|---|
| New Jersey | $2,923 | Thanksgiving (+16.5%) |
|---|
| New York | $2,840 | New Year’s Day (+17%) |
|---|
| Connecticut | $2,652 | Thanksgiving (+23.1%) |
|---|
Note: Insurify ranks Washington, D.C., as the most expensive “state” for car insurance in its most recent auto insurance report, but D.C. is excluded because CMT.AI data covers the 50 states.
Drivers in the most expensive states for car insurance may have more to lose from a risky holiday drive. An accident in a state with higher premiums can cost more, even when drivers aren’t any riskier overall.
Numerous factors affect the cost of car insurance — especially personal driving record, location, and vehicle type. The cost of auto repairs, severe weather, and incident rates all contribute to local claims risk, which affects insurance premiums.
For example, in Maryland, where the average annual premium is nearly $4,000, causing an accident could push premiums above $5,000 per year. So while there’s an elevated road risk during the holidays, driving safely can help ensure drivers don’t face higher premiums in the new year.
| Average Annual Full-Coverage Car Insurance Premium | Average Annual Car Insurance Premium for Drivers With a Speeding Ticket | Average Annual Car Insurance Premium for Drivers With an At-Fault Accident | Average Annual Car Insurance Premium for Drivers With a DUI |
|---|
| Maryland | $3,880 | $5,005 | $5,199 | $5,548 |
|---|
| Rhode Island | $3,611 | $4,658 | $4,839 | $5,164 |
|---|
| Michigan | $3,229 | $4,165 | $4,327 | $4,617 |
|---|
| Georgia | $3,109 | $4,011 | $4,166 | $4,446 |
|---|
| Delaware | $3,100 | $3,999 | $4,154 | $4,433 |
|---|
| South Carolina | $3,075 | $3,967 | $4,121 | $4,397 |
|---|
| Nevada | $3,039 | $3,920 | $4,072 | $4,346 |
|---|
| New Jersey | $2,923 | $3,771 | $3,917 | $4,180 |
|---|
| New York | $2,840 | $3,664 | $3,806 | $4,061 |
|---|
| Connecticut | $2,652 | $3,421 | $3,554 | $3,792 |
|---|

 Writer: Julia TaliesinEconomic Analyst, Licensed Insurance Agent
 Editor: Evelyn PimplaskarEditor-in-Chief, Director of Content