Homeward Bound: Cities With Greatest Pandemic Real Estate Booms

insurify insights
Insurify InsightsData & Research Team

Insurify’s team of data scientists and content specialists presents Insurify Insights, a series of automotive, home, and health studies focusing on the topics that impact us all. Through expert analysis of over 4 million car insurance applications and an array of top data sources, the Insurify Insights team produces new data-driven articles, trend analyses, regional superlatives, and national rankings every week. See Insurify Insights as featured in Forbes, Fox News, USA Today, NPR, and more.

Published

Advertiser Disclosure

At Insurify, our goal is to help customers compare insurance products and find the best policy for them. We strive to provide open, honest, and unbiased information about the insurance products and services we review. Our hard-working team of data analysts, insurance experts, insurance agents, editors and writers, has put in thousands of hours of research to create the content found on our site.

We do receive compensation when a sale or referral occurs from many of the insurance providers and marketing partners on our site. That may impact which products we display and where they appear on our site. But it does not influence our meticulously researched editorial content, what we write about, or any reviews or recommendations we may make. We do not guarantee favorable reviews or any coverage at all in exchange for compensation.

Why you can trust Insurify: Comparing accurate insurance quotes should never put you at risk of spam. We earn an agent commission only if you buy a policy based on our quotes. Our editorial team follows a rigorous set of editorial standards and operates independently from our insurance partners. Learn more.

Share

Staying at home has never been more of a priority, and many Americans are eager to invest in a new nest.

2020 has been full of surprises. The economic shutdown incited by the coronavirus pandemic has sent irrevocable shockwaves across vast economic sectors. While many industries have seen irreparable damage, causing businesses to shut down at alarming rates, some, like the housing market, have seen unexpected upturns.

Individuals who are not essential workers and are privileged enough to keep working remotely during COVID-19 seem to be experiencing a shift in priorities for their homes. Being close to the city’s center may have been a plus before the pandemic, but now in the age of constant Zoom meetings and extended stay-at-home orders, ample indoor space seems to be in higher demand. Vital components of city life like public transportation, live entertainment venues, and bustling bars and restaurants that may have been an initial draw to urban life are now seen as risky public health hazards. Major cities like New York City and Seattle with notoriously high demands for housing — and high prices to match — have seen their affluent homeowners start to look beyond city living.

Housing market trends are shaped by many socioeconomic and cultural factors, and home preferences are likely to cycle and change over time. There’s no denying, however, that the pandemic has had significant effects on real estate and the types of properties and locations that are now seen as desirable. To further understand COVID-19’s impact on the housing market, the data science team at Insurify examined national real estate data to identify the cities with the greatest surge in home sales during the pandemic.

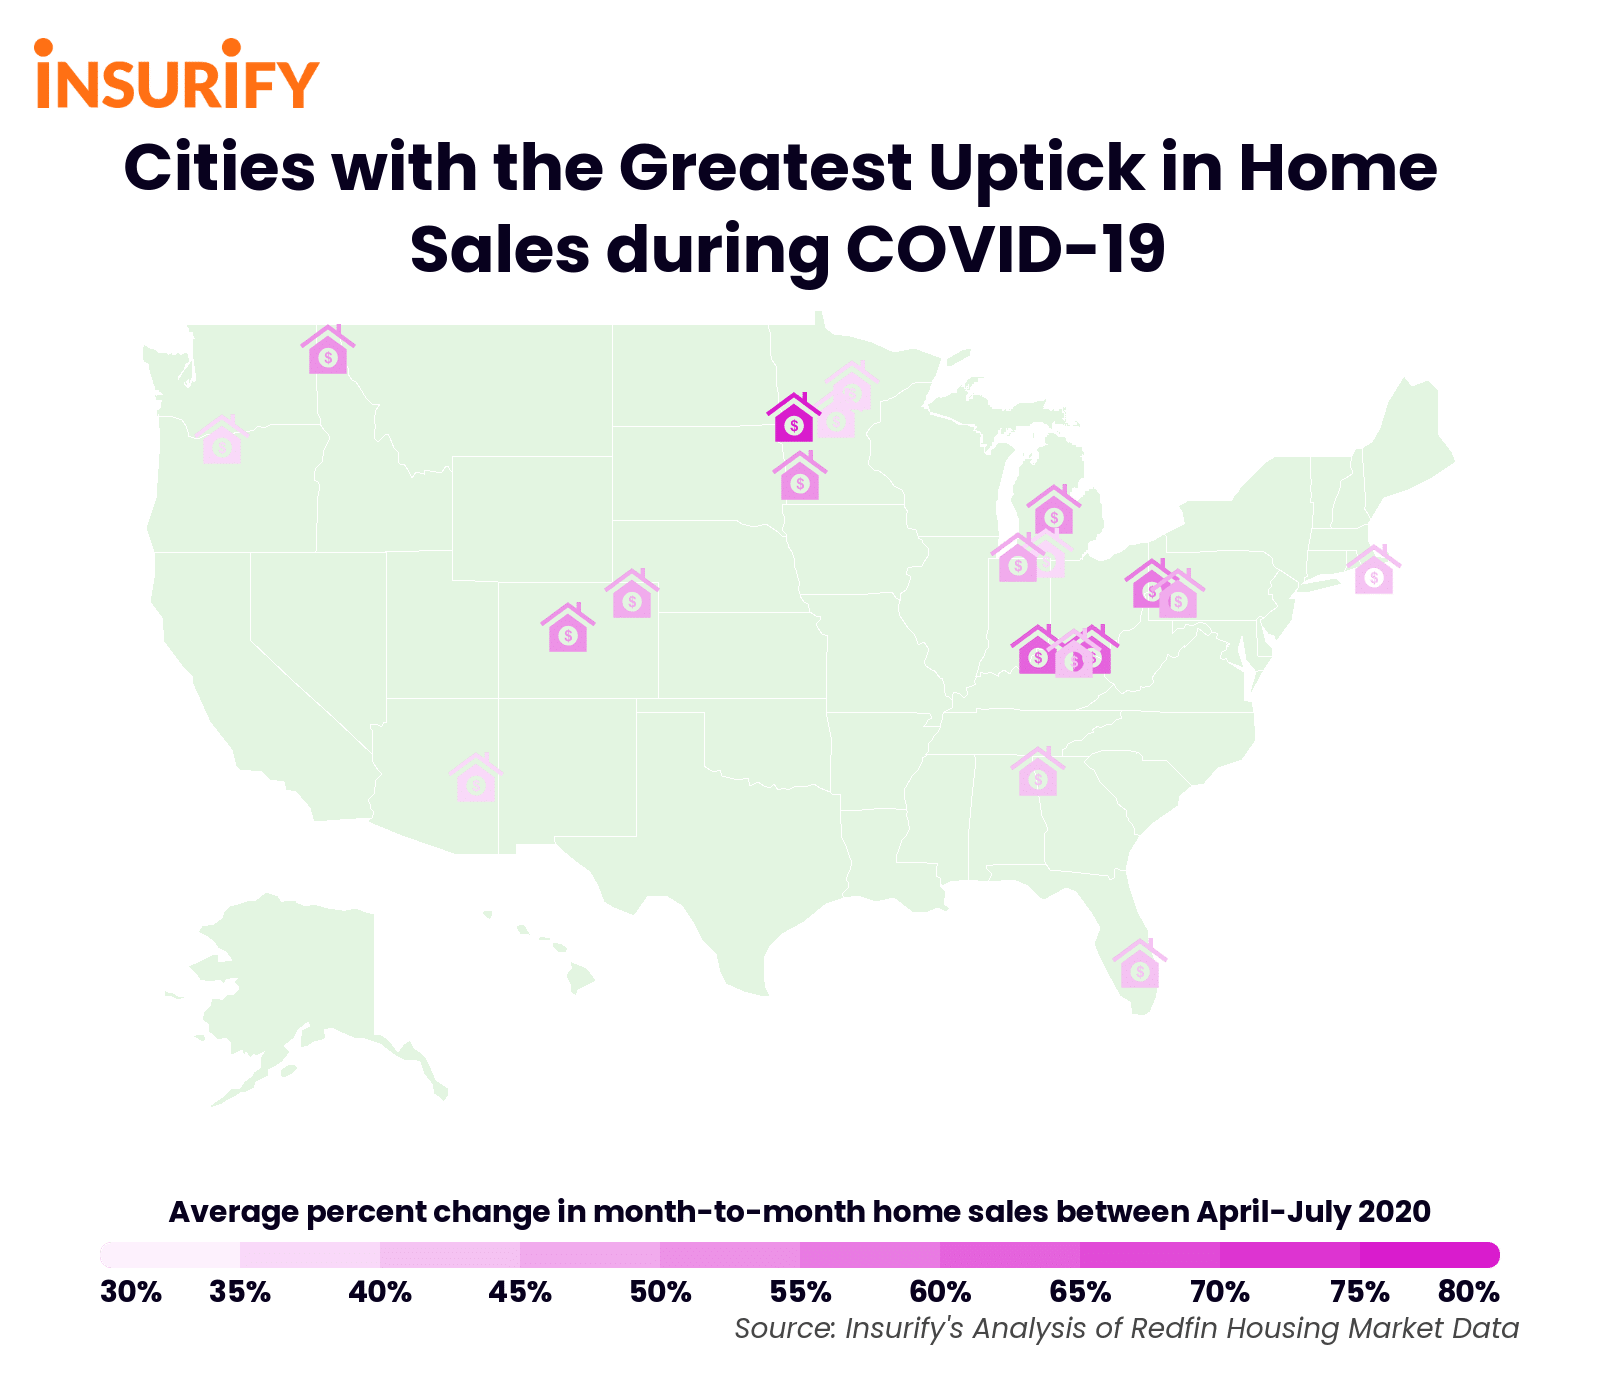
An icon map showing the twenty cities with the greatest surge in home sales during the COVID-19 pandemic.

Table of contents

Insights

  • National averages. Between April and July 2020, the average rate of homes on the market sold month to month was up overall, at 14.89 percent. The average number of monthly new listings during this time period was 827 per metropolitan area. The average sale price across homes on the market in the U.S. was $310K.

  • New home buyers are not necessarily breaking the bank. 75 percent of the cities in this ranking had a median sale price below the national average as of July 2020. COVID-19 has had varying effects on home prices throughout the year due to a drop in demand around March, with a strong rebound in June — as the pandemic continues to play out, the housing market will still be susceptible to peaks and valleys in supply and demand. However, for the cities with the greatest upticks in month-over-month home sales from April through July 2020, home prices have not been astronomical (with the exception of  #15 on the list, which is a stark outlier). This insight suggests that, while new home buyers are likely more relatively affluent— they have the financial stability during a major recession to be able to invest in real estate —  the majority of them are not looking at homes with the highest market values, but rather opting for more affordable choices.

  • The rise of rural escapism. Many of the cities with the greatest surge in home sales during quarantine are not bustling metropolises, but rather spots advertised as vacation destinations or, at the very least, idyllic suburban living. While not all of these cities are luxury vacation spots — as many of the median home values are below the national average — many across the rankings are marketed as an escape from urban dwelling. The sudden popularity of quiet, peaceful, and spacious living areas that has superseded the desire to be in the center of a bustling city is indicative of the pandemic’s significant effects on the housing market.

Methodology

The data science team at Insurify, a website to compare home insurance rates, analyzed the Housing Market Data report from Redfin, a national real estate brokerage. Redfin publishes timely data demonstrating trends in the housing market, including statistics regarding property prices, inventory, and sales across the United States on metropolitan and national levels. To identify the cities with the greatest uptick in home sales throughout the pandemic, researchers located the metropolitan areas within the U.S. that had the highest percentage of homes on the market sold month-over-month between April and July 2020, following nationwide lockdown in March. The number of homes sold month-to-month are recorded on a per month basis, so Insurify’s researchers took the average of home sales rates for April-July 2020 and ranked states based on the highest composite averages for the post-lockdown months. The number of new home listings and median sale prices as of July 2020 were additionally provided by Redfin.

Best Sales During COVID 19

1. Fergus Falls, MN - Average rate of monthly home sales during quarantine: 78.08%

2. Madison, IN - Average rate of monthly home sales during quarantine: 58.33%

3. Portsmouth, OH - Average rate of monthly home sales during quarantine: 58.33%

4. New Castle, PA - Average rate of monthly home sales during quarantine: 53.33%

5. Breckenridge, CO - Average rate of monthly home sales during quarantine: 51.45%

6. Alma, MI - Average rate of monthly home sales during quarantine: 50.90%

7. Marshall, MN - Average rate of monthly home sales during quarantine: 47.88%

8. Sandpoint, ID - Average rate of monthly home sales during quarantine: 47.60%

9. Sterling, CO - Average rate of monthly home sales during quarantine: 47.08%

10. Indiana, PA - Average rate of monthly home sales during quarantine: 46.33%

U.S. Cities with the Greatest Uptick in Home Sales During COVID-19

20. Show Low, AZ

  • Average rate of monthly home sales during quarantine: 34.75%

  • Average number of new listings per month: 64

  • Median sale price (July 2020): $312K

Trending On Insurify

Your Lone Star home deserves the best protection – here’s everything you need to know about cheap homeowners insurance in Texas.

Find the best rates for Arizona homeowners insurance with Insurify.

19. Coldwater, MI

  • Average rate of monthly home sales during quarantine: 35.23%

  • Average number of new listings per month: 43

  • Median sale price (July 2020): $130K

18. Brainerd, MN

  • Average rate of monthly home sales during quarantine: 36.68%

  • Average number of new listings per month: 256

  • Median sale price (July 2020): $275K

Trending On Insurify

It may be the Golden State, but you don’t need to shell out gold to protect your home there – here’s the cheapest home insurance in California.

Get your perfect quote for North Carolina home insurance and save big in the Tarheel State today.

New York home insurance policies can be both affordable and comprehensive. Here’s what our experts have to say about getting home insurance in the Empire State.

17. The Dalles, OR

  • Average rate of monthly home sales during quarantine: 36.93%

  • Average number of new listings per month: 34

  • Median sale price (July 2020): $325K

16. Grand Rapids, MN

  • Average rate of monthly home sales during quarantine: 37.40%

  • Average number of new listings per month: 78

  • Median sale price (July 2020): $161K

Trending On Insurify

Home insurance in the south is sure peachy! Find cheap homeowners insurance in Georgia with Insurify.

Insurify’s guide to Pennsylvania home insurance will help you save time and money securing your home in the Keystone State.

Here’s the cheapest home insurance in Florida, guaranteed by Insurify’s expert’s standards.

15. Vineyard Haven, MA

  • Average rate of monthly home sales during quarantine: 37.50%

  • Average number of new listings per month: 14

  • Median sale price (July 2020): $1,410K

14. Okeechobee, FL

  • Average rate of monthly home sales during quarantine: 37.58%

  • Average number of new listings per month: 21

  • Median sale price (July 2020): $230K

13. Summerville, GA

  • Average rate of monthly home sales during quarantine: 39.63%

  • Average number of new listings per month: 8

  • Median sale price (July 2020): $117K

12. Maysville, KY

  • Average rate of monthly home sales during quarantine: 41.68%

  • Average number of new listings per month: 4

  • Median sale price (July 2020): $126K

11. Niles, MI

  • Average rate of monthly home sales during quarantine: 45.83%

  • Average number of new listings per month: 275

  • Median sale price (July 2020): $224K

10. Indiana, PA

  • Average rate of monthly home sales during quarantine: 46.33%

  • Average number of new listings per month: 53

  • Median sale price (July 2020): $135K

9. Sterling, CO

  • Average rate of monthly home sales during quarantine: 47.08%

  • Average number of new listings per month: 21

  • Median sale price (July 2020): $175K

8. Sandpoint, ID

  • Average rate of monthly home sales during quarantine: 47.60%

  • Average number of new listings per month: 112

  • Median sale price (July 2020): $430K

7. Marshall, MN

  • Average rate of monthly home sales during quarantine: 47.88%

  • Average number of new listings per month: 39

  • Median sale price (July 2020): $150K

6. Alma, MI

  • Average rate of monthly home sales during quarantine: 50.90%

  • Average number of new listings per month: 9

  • Median sale price (July 2020): $95K

5. Breckenridge, CO

  • Average rate of monthly home sales during quarantine: 51.45%

  • Average number of new listings per month: 88

  • Median sale price (July 2020): $580K

4. New Castle, PA

  • Average rate of monthly home sales during quarantine: 53.33%

  • Average number of new listings per month: 73

  • Median sale price (July 2020): $117K

3. Portsmouth, OH

  • Average rate of monthly home sales during quarantine: 58.33%

  • Average number of new listings per month*: 4

  • Median sale price (July 2020): $148K

2. Madison, IN

  • Average rate of monthly home sales during quarantine: 58.33%

  • Average number of new listings per month: 7

  • Median sale price (July 2020): $146K

1. Fergus Falls, MN

  • Average rate of monthly home sales during quarantine: 78.08%

  • Average number of new listings per month: 28

  • Median sale price (July 2020): $265K

*Calculation only inclusive of statistics from April-June 2020 (does not include estimates from July)

Data Attribution

The information, statistics, and data visualizations on this page are free to use, we just ask that you attribute any full or partial use to Insurify with a link to this page. Thank you!

If you have questions or comments about this article, please contact [email protected].

Insurify Insights
Insurify InsightsData & Research Team

Insurify’s team of data scientists and content specialists presents Insurify Insights, a series of automotive, home, and health studies focusing on the topics that impact us all. Through expert analysis of over 4 million car insurance applications and an array of top data sources, the Insurify Insights team produces new data-driven articles, trend analyses, regional superlatives, and national rankings every week. See Insurify Insights as featured in Forbes, Fox News, USA Today, NPR, and more.