Cities With the Most Stolen Cars in America (2022)
Published
Published
When it comes to car theft, the nation’s biggest cities may make the most headlines, but every state has areas where drivers should take extra precaution to secure their vehicle.![]()
Car theft is a major concern for many American drivers and for good reason: there are more than 880,000 vehicle thefts each year across the United States, according to the most recent data from the National Insurance Crime Bureau’s (NICB) Hot Spots report. To put this huge number in perspective, an average of one vehicle is stolen in the U.S. every 36 seconds.
While the country’s biggest cities have a reputation for being carjacking hotbeds, the reality is that car theft poses a risk to drivers everywhere, especially since the beginning of the COVID-19 pandemic. The NICB notes that the pandemic created multiple national crises — including an economic slump and diminished school and social programming — that correlate with increased car theft rates. In America, the total number of vehicles stolen rose 11% between 2019 and 2020, marking a sharp departure from several years of modest declines in carjackings. With theft rates on the rise, drivers should be vigilant about locking their car and keeping valuables out of sight, especially in areas of higher risk. Drivers who have unfortunately fallen victim to car theft can take steps such as filing a police report, having the right paperwork on hand when talking to their insurance company, and remembering to file a stolen vehicle report with the DMV as well.
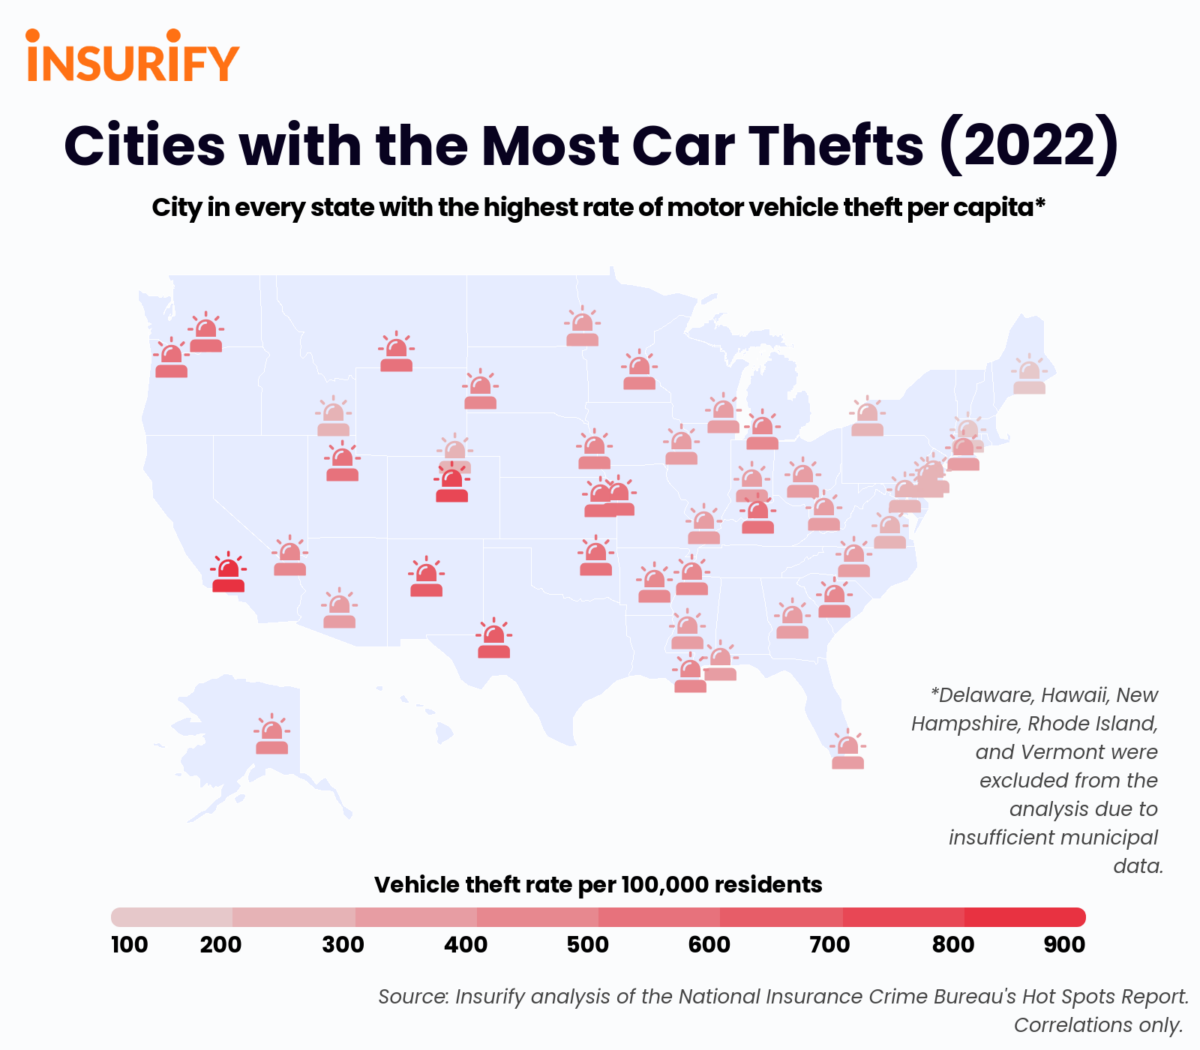
Curious to see where carjackings are most common in every state, the data scientists at Insurify analyzed NICB data to identify the city in each state with the highest car theft rate.
National averages. The average car theft rate across all cities in the U.S. is 288 vehicles per 100,000 residents, or about one stolen car per year for every 347 residents. For context, carjackings occur about as often as American drivers buy electric vehicles, which they did at a rate of one new car per 468 drivers in 2021, according to data from Cox Automotive and Statista.
Wild, Wild West. While car theft occurs everywhere in America, it is most common in Western states. The ten U.S. cities with the highest rates of vehicle theft all reside in the West; California even has four cities in the top ten, including the top two. Overall, carjackings occur 2.3 times more often in these cities than in the country as a whole.
Vehicle safe haven. Far from the American West, State College, Pennsylvania, is the safest U.S. city for cars in 2022. Its car theft rate of just 17 vehicles per 100,000 residents is a whopping 94% less than the national average. Residents of State College — which, as its name suggests, is home to Penn State University — apparently take extreme care to secure their vehicles and are constantly looking out for each other’s rides.
The data scientists at Insurify, a car insurance comparison site, compiled data from the National Insurance Crime Bureau’s (NICB) most recent Hot Spots report on auto theft rates in 382 Metropolitan Statistical Areas (MSA’s) across the United States. From this data, they identified the metro area in every state reporting the highest auto theft incidence per 100,000 residents, as well as the top ten cities overall with the highest auto theft rates. The data scientists identified these MSA’s as the cities with the most car thefts in 2022. Due to insufficient metropolitan area data, Delaware, Hawaii, New Hampshire, Rhode Island, and Vermont were excluded from this analysis.
Population data for each metro area was gathered from the United States Census Bureau.
The findings in this article represent statistical trends found in Insurify’s analysis of the National Insurance Crime Bureau’s Hot Spots data. The findings of this study are not meant to imply the direction nor necessarily the existence of a causal relationship. Rather, this is a presentation of statistical correlations of public interest.
1. Bakersfield, CA - Motor vehicle thefts per 100k residents: 905
2. Yuba City, CA - Motor vehicle thefts per 100k residents: 724
3. Denver, CO - Motor vehicle thefts per 100k residents: 706
4. Odessa, TX - Motor vehicle thefts per 100k residents: 664
5. San Francisco, CA - Motor vehicle thefts per 100k residents: 655
6. Albuquerque, NM - Motor vehicle thefts per 100k residents: 632
7. Pueblo, CO - Motor vehicle thefts per 100k residents: 602
8. Billings, MT - Motor vehicle thefts per 100k residents: 565
9. Tulsa, OK - Motor vehicle thefts per 100k residents: 552
10. San Jose, CA - Motor vehicle thefts per 100k residents: 551
Population: 429,536
Motor vehicle thefts per 100,000 residents: 304 (26% greater than state average)
Population: 96,849
Motor vehicle thefts per 100,000 residents: 381 (2% greater than state average)
Population: 4,948,203
Motor vehicle thefts per 100,000 residents: 279 (35% greater than state average)
Population: 742,384
Motor vehicle thefts per 100,000 residents: 402 (17% greater than state average)
Population: 900,202
Motor vehicle thefts per 100,000 residents: 905 (53% greater than state average)
Population: 2,967,239
Motor vehicle thefts per 100,000 residents: 706 (45% greater than state average)
Population: 854,757
Motor vehicle thefts per 100,000 residents: 338 (31% greater than state average)
Population: 6,166,488
Motor vehicle thefts per 100,000 residents: 289 (40% greater than state average)
Population: 229,996
Motor vehicle thefts per 100,000 residents: 336 (35% greater than state average)
Population: 95,489
Motor vehicle thefts per 100,000 residents: 186 (28% greater than state average)
Population: 135,764
Motor vehicle thefts per 100,000 residents: 279 (33% greater than state average)
Population: 2,074,537
Motor vehicle thefts per 100,000 residents: 349 (39% greater than state average)
Population: 379,172
Motor vehicle thefts per 100,000 residents: 329 (42% greater than state average)
Population: 231,969
Motor vehicle thefts per 100,000 residents: 535 (36% greater than state average)
Population: 1,265,108
Motor vehicle thefts per 100,000 residents: 506 (46% greater than state average)
Population: 1,270,530
Motor vehicle thefts per 100,000 residents: 395 (28% greater than state average)
Population: 152,148
Motor vehicle thefts per 100,000 residents: 84 (22% greater than state average)
Population: 2,800,053
Motor vehicle thefts per 100,000 residents: 226 (53% greater than state average)
Population: 697,382
Motor vehicle thefts per 100,000 residents: 149 (41% greater than state average)
Population: 265,066
Motor vehicle thefts per 100,000 residents: 371 (54% greater than state average)
Population: 3,640,043
Motor vehicle thefts per 100,000 residents: 376 (49% greater than state average)
Population: 594,806
Motor vehicle thefts per 100,000 residents: 332 (13% greater than state average)
Population: 2,157,990
Motor vehicle thefts per 100,000 residents: 545 (34% greater than state average)
Population: 181,667
Motor vehicle thefts per 100,000 residents: 565 (41% greater than state average)
Population: 949,442
Motor vehicle thefts per 100,000 residents: 397 (38% greater than state average)
Population: 2,266,715
Motor vehicle thefts per 100,000 residents: 407 (30% greater than state average)
Population: 918,018
Motor vehicle thefts per 100,000 residents: 632 (43% greater than state average)
Population: 367,430
Motor vehicle thefts per 100,000 residents: 171 (22% greater than state average)
Population: 1,127,983
Motor vehicle thefts per 100,000 residents: 220 (61% greater than state average)
Population: 771,851
Motor vehicle thefts per 100,000 residents: 273 (30% greater than state average)
Population: 246,145
Motor vehicle thefts per 100,000 residents: 267 (27% greater than state average)
Population: 2,122,271
Motor vehicle thefts per 100,000 residents: 290 (28% greater than state average)
Population: 998,626
Motor vehicle thefts per 100,000 residents: 552 (39% greater than state average)
Population: 2,492,412
Motor vehicle thefts per 100,000 residents: 490 (43% greater than state average)
Population: 6,102,434
Motor vehicle thefts per 100,000 residents: 213 (67% greater than state average)
Population: 838,433
Motor vehicle thefts per 100,000 residents: 419 (26% greater than state average)
Population: 142,107
Motor vehicle thefts per 100,000 residents: 400 (3% greater than state average)
Population: 1,346,045
Motor vehicle thefts per 100,000 residents: 460 (37% greater than state average)
Population: 166,223
Motor vehicle thefts per 100,000 residents: 664 (59% greater than state average)
Population: 1,232,696
Motor vehicle thefts per 100,000 residents: 542 (60% greater than state average)
Population: 1,291,900
Motor vehicle thefts per 100,000 residents: 214 (44% greater than state average)
Population: 250,873
Motor vehicle thefts per 100,000 residents: 488 (46% greater than state average)
Population: 257,074
Motor vehicle thefts per 100,000 residents: 268 (47% greater than state average)
Population: 1,575,179
Motor vehicle thefts per 100,000 residents: 345 (66% greater than state average)
Population: 99,500
Motor vehicle thefts per 100,000 residents: 237 (9% greater than state average)
National Insurance Crime Bureau. “ 2020 Hot Spots.” Accessed February 2022.
Cox Automotive. “ Strong Finish: EV Sales Mark New Record in Fourth Quarter of 2021.” Accessed March 2022.
Statista. “ Total number of licensed drivers in the U.S. in 2020, by state.” Accessed March 2022.
U.S. Census Bureau. “ Metropolitan and Micropolitan Statistical Areas Population Totals and Components of Change: 2010-2019.” Accessed February 2022.
The information, statistics, and data visualizations on this page are free to use, we just ask that you attribute any full or partial use to Insurify with a link to this page. Thank you!
If you have any questions or comments about this article or would like to request the data, please contact [email protected].
At Insurify, our goal is to help customers compare insurance products and find the best policy for them. We strive to provide open, honest, and unbiased information about the insurance products and services we review. Our hard-working team of data analysts, insurance experts, insurance agents, editors and writers, has put in thousands of hours of research to create the content found on our site.
We do receive compensation when a sale or referral occurs from many of the insurance providers and marketing partners on our site. That may impact which products we display and where they appear on our site. But it does not influence our meticulously researched editorial content, what we write about, or any reviews or recommendations we may make. We do not guarantee favorable reviews or any coverage at all in exchange for compensation.